Dashboards / Business KPI dashboard
Business KPI dashboard for Excel & Google Sheets
Dashboard with revenue, target, attainment and a six-month chart. Edit the Data sheet and the tiles recalculate.
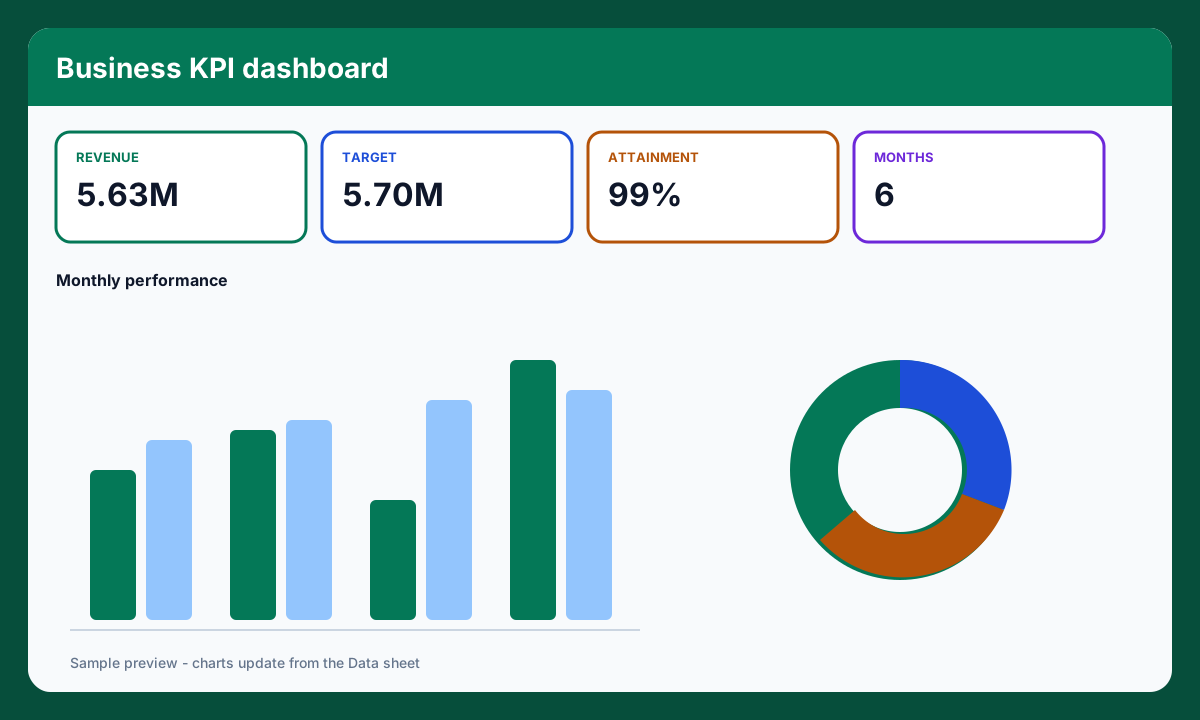
Preview of the dashboard. Charts recalculate when you edit the Data sheet.
What's included
- Four KPI tiles linked to formulas
- Column chart: revenue vs target
- Doughnut mix chart
- Sample months you replace
Sample workbook. Replace the sample rows on the Data sheet.