Dashboards / Executive monthly report
Executive report: revenue, cost and profit
Six-month profit and loss view. Profit and margin are formulas. Premium colour workbook, unlocked once.
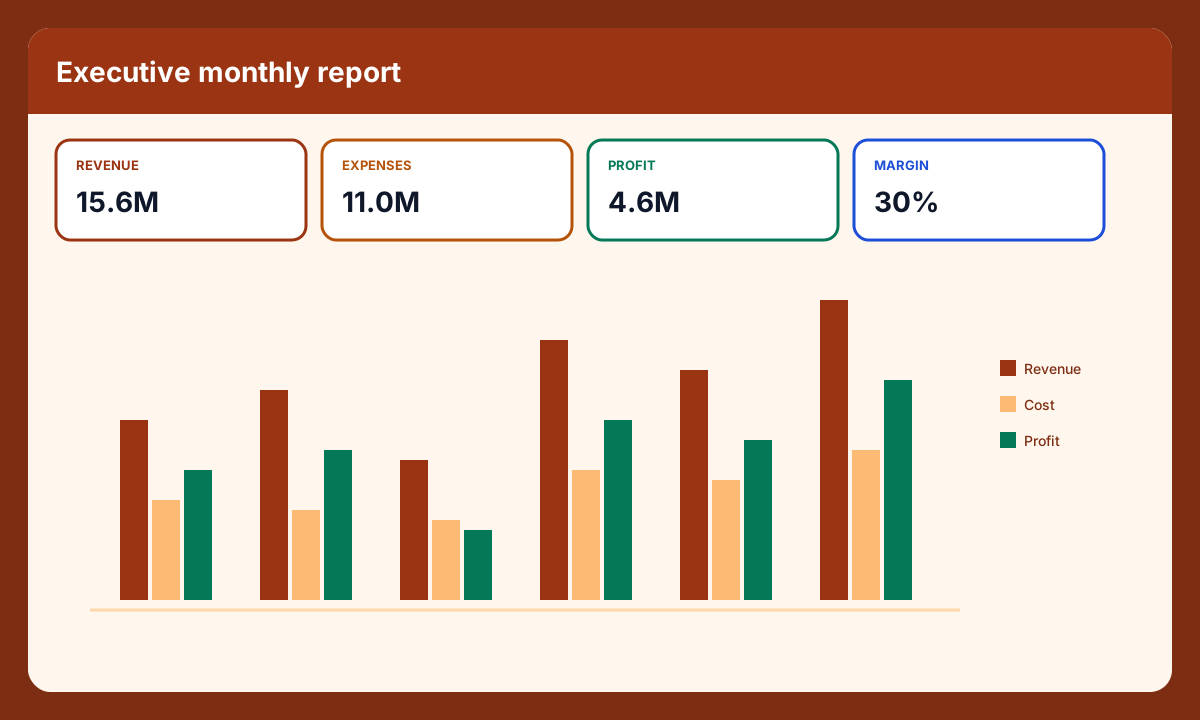
Preview of the dashboard. Charts recalculate when you edit the Data sheet.
What's included
- Revenue, expenses, profit, margin tiles
- Clustered column chart
- Profit calculated from revenue minus cost
Sample workbook. Replace the sample rows on the Data sheet.